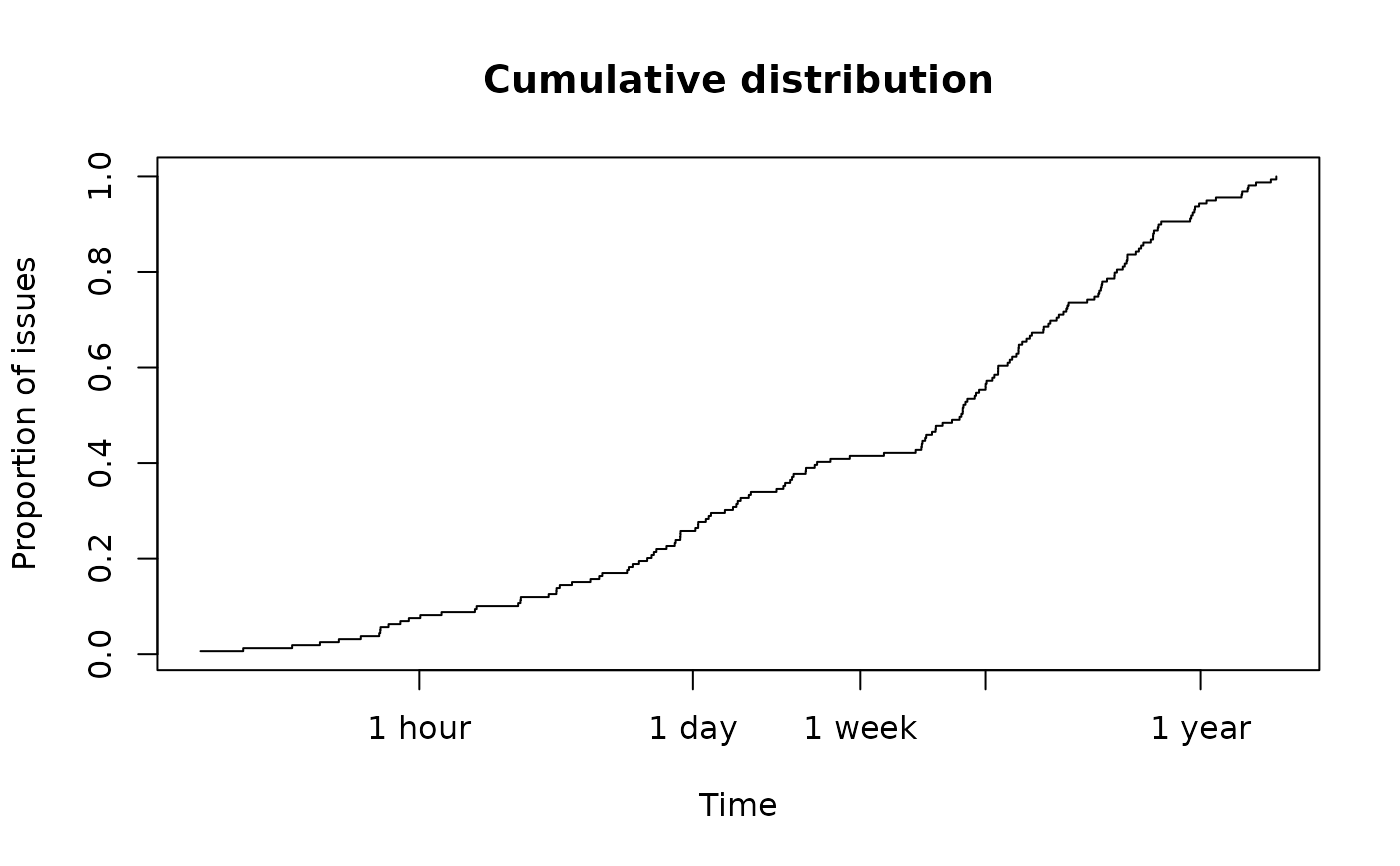
Creates an ECDF plot showing the cumulative distribution of issue resolution times on a log scale (1 hour, 1 day, 1 week, 1 month, 1 year, 3 years).
plot_resolution_ecdf(x, verbose = TRUE)Arguments
Value
Invisibly returns NULL.
Examples
issues_selector <- init_selector(
    source = "Local",
    dataset_dir = system.file("data_issues", package = "IssueTrackeR"),
    dataset_name = NULL
)
my_issues <- get_issues(selector = issues_selector)
#> The issues will be read from /home/runner/work/_temp/Library/IssueTrackeR/data_issues/list_issues.yaml.

IssueTrackeR:::plot_resolution_ecdf(my_issues)